The Extract Engine

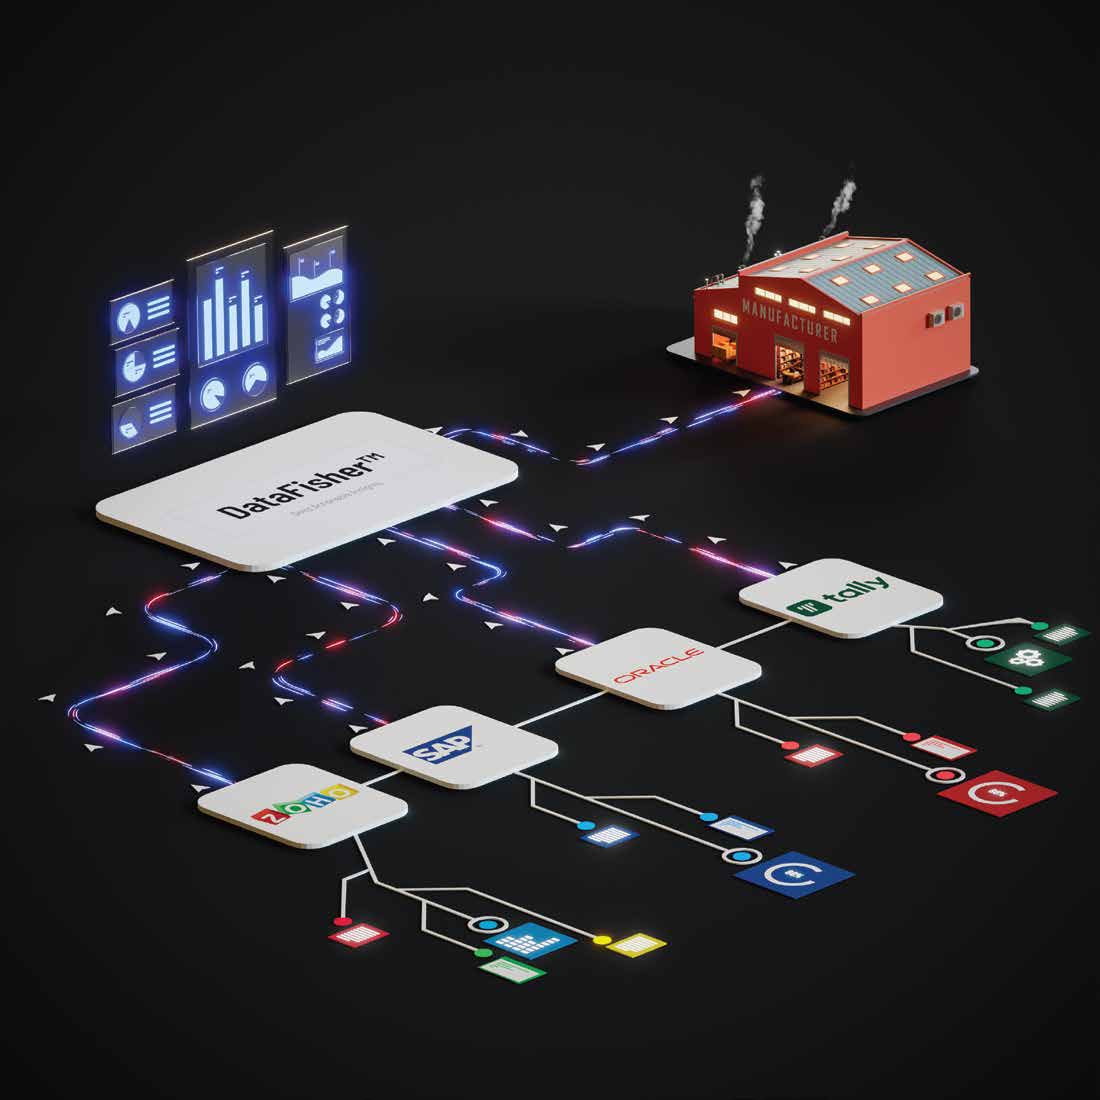
Your value chain data exists. It’s trapped in 200 different systems.

Distributors run Tally. Service partners run custom ERPs. Retailers use POS software you’ve never heard of. Loyalty data sits in a marketing platform. You have zero real-time visibility into any of it. DataFisher® is the enterprise intelligence engine that reaches into every disconnected system across your entire ecosystem and surfaces the data you’ve never had.

DataFisher® — diving deep into enterprise data ecosystems
The Visibility Crisis

Your enterprise is flying blind across every stage of the value chain.

It’s not just secondary sales you can’t see. It’s service resolution quality at your partner workshops. It’s real-time stock levels across 300 retail outlets. It’s whether your loyalty program is actually driving repeat purchases or just burning budget. The data exists. It’s just locked inside systems you don’t own, can’t access, and have never been able to read.

Every stage of your value chain was automated independently, by different vendors, in different decades. The result is an archipelago of disconnected data islands — each one holding a fragment of the truth, none of them willing to share.

📦

Distribution Blind Spot

Your distributors bought from you. But what did they sell? To whom? At what margin? What’s still sitting in their warehouse? Their accounting system knows. You don’t.

🛠

Service Black Hole

Warranty claims are rising, but you can’t see resolution times, parts consumption patterns, or whether partner technicians are even following your protocols. The service data lives in their system, not yours.

👤

Customer Sentiment Void

NPS surveys go to one platform. Purchase history sits in another. Loyalty engagement is in a third. Feedback from service interactions never leaves the service tool. You have customer data everywhere and a customer view nowhere.

💰

Financial Fog

Outstanding receivables across your partner network are a guess, not a number. Credit exposure is calculated quarterly in spreadsheets, not measured in real time from actual ledger data.

📊

Inventory Mirage

Channel stock reports arrive in Excel files on the 15th of the month. By the time you aggregate them, the data is three weeks stale. Stockouts and overstocks are discovered, not predicted.

Loyalty Disconnect

Your loyalty program runs on engagement. But you can’t connect points earned to products purchased to service experiences to repeat behavior. The loop is open because the data is fragmented.

200+
Disconnected systems in
a typical enterprise ecosystem
0%
Real-time cross-system
visibility without extraction
3–6w
Average age of partner
data when it reaches HQ
Extraction Methodology

Four ways in. One unified data fabric out.

DataFisher® doesn’t ask partners to change their systems or learn new tools. It meets every data source where it lives — through the extraction method that fits, with graceful fallback when the ideal path isn’t available.

DataFisher® — intelligence extraction across the value chain

A deep-sea diver for enterprise intelligence.

Think of your value chain as an ocean. The intelligence you need — secondary sales, service quality, customer sentiment, stock velocity, credit health — is scattered across the sea floor, locked inside hundreds of independent systems.

DataFisher® is the diver. It goes deep into each system, extracts the data that matters, normalizes it into a unified schema, and surfaces it as actionable intelligence — ready for analysis, anomaly detection, and prediction.

The enterprise that sees its entire value chain in real time doesn’t just react faster. It predicts. It prevents. It compounds advantage with every data point collected.
01
🔗

API Connectors

Pre-built integrations for major ERP and accounting platforms. Real-time, bi-directional data sync with structured schemas. The fastest, most reliable extraction path.

Preferred Path
02
📄

File Upload Parsers

Intelligent parsers that ingest Excel, CSV, PDF, and structured file exports from any system. Template-based mapping with AI-assisted column recognition. Zero configuration for partners.

Universal Fallback
03
🤖

Screen Scraping Agents

Autonomous agents that log into partner-authorized web interfaces, navigate to the relevant screens, and extract data directly. For systems with no API and no export capability.

AI-Powered
04

Manual Entry Fallback

For partners still operating on paper or legacy systems with no digital access. Guided mobile forms with photo capture, OCR, and validation rules. No partner left behind.

Zero Tech Barrier
All paths converge into one unified data fabric
The Data Landscape

Every system across every stage of the value chain.

DataFisher® doesn’t connect to a category of software. It connects to your reality — the actual tools your partners, service teams, retailers, and customers use every day.

📦

Distribution & Accounting

The financial and transactional backbone of your partner network. Invoice data, payment cycles, receivables, product-wise purchase patterns.

  • Tally ERP / TallyPrime
  • Busy Accounting
  • SAP Business One
  • QuickBooks / Zoho Books
  • Custom partner ERPs
  • Legacy DOS-based systems
🛠

Service & Field Operations

The operational truth of your service quality. Resolution data, warranty claims, parts consumption, technician productivity, SLA compliance.

  • Service CRM platforms
  • Warranty management systems
  • Field service scheduling tools
  • Parts inventory databases
  • Call center / ticketing systems
  • Partner workshop software
👤

Customer & Loyalty

The full picture of customer behavior across the lifecycle. Purchase history, engagement signals, sentiment data, loyalty mechanics, churn indicators.

  • POS / retail billing systems
  • CRM platforms (Salesforce, HubSpot)
  • Loyalty & rewards engines
  • NPS / feedback platforms
  • E-commerce order systems
  • Mobile app engagement data

50+ pre-built connectors. From enterprise ERP suites to regional accounting tools that only exist in one country. If your partners use it, DataFisher® can reach it.

Intelligence Outputs

What surfaces when you can finally see everything.

DataFisher® doesn’t just move data. It transforms fragmented signals into enterprise intelligence that spans manufacturing, distribution, service, customer engagement, and loyalty.

📊

Secondary Sales Intelligence

Real-time sell-through data from every distributor and retailer in your network. Product-wise, geography-wise, time-series analysis. Not what you shipped — what actually sold to the end customer.

Distribution
🗃

Network Stock Visibility

Live inventory positions across every node in your value chain. Aging analysis, velocity metrics, reorder triggers. Transform channel stock from a quarterly guess into a daily operating metric.

Inventory
⚠️

Anomaly Detection

AI-powered pattern recognition across all extracted data. Sudden drops in a distributor’s purchase frequency. Unusual warranty claim spikes in a region. Loyalty engagement decay before churn. Flagged before they become crises.

AI-Powered
💰

Receivables & Credit Health

Real-time outstanding receivables extracted from partner ledgers. Credit exposure calculated daily, not quarterly. Payment behavior patterns that predict defaults before they happen.

Financial
🛠

Service Quality Index

Resolution times, first-time-fix rates, parts usage efficiency, customer satisfaction scores — all extracted from partner service systems. A real-time quality index for your entire service network.

Service
📈

Predictive Demand Sensing

When you see secondary sales, stock velocity, and purchase patterns in real time, demand forecasting becomes a function of actual market behavior — not sales team estimates or historical averages.

Predictive
Platform DNA

Built on BizGaze. Powered by AI. Configured, not coded.

DataFisher® isn’t a standalone analytics product bolted onto your stack. It’s an engine within the BizGaze platform — built on Report Builder, supercharged with AI, and configured entirely through zero-code interfaces.

📊 Report Builder Foundation

Every byte of data that DataFisher® extracts flows directly into BizGaze’s Report Builder — the same self-service analytics engine used across the entire platform. No separate BI tool. No data warehouse to maintain. No ETL pipelines to debug.

  • Drag-and-drop report creation from extracted data sources
  • Pre-built report templates for secondary sales, stock, receivables, and service metrics
  • Scheduled delivery: automated reports pushed via email, WhatsApp, or in-app notifications
  • Role-based access: every stakeholder sees only the data relevant to their scope
  • Export to PDF, Excel, or embed live dashboards in any Canvas layout

🤖 AI-Powered Analysis

DataFisher® doesn’t just present data. It interprets it. AI models trained on your enterprise’s operational patterns detect anomalies, surface correlations, and generate predictions that would take human analysts weeks to produce.

  • Natural language queries: ask questions about your value chain data in plain English
  • Automatic anomaly alerts with root-cause hypothesis generation
  • Cross-domain pattern recognition: correlate service data with distribution trends
  • Predictive models for demand, churn, default risk, and service load
  • AI-generated executive summaries: weekly intelligence briefs, not raw dashboards
DataFisher® integration architecture

Integration Architecture

50+ connectors. Four extraction methods. One unified schema feeding every report, dashboard, and AI model in the platform.

DataFisher® orchestration layer

Orchestration Layer

Scheduling, transformation, validation, and routing. Every extraction job is managed, monitored, and recoverable — configured through zero-code workflows.

The Compounding Effect

More data in. Better predictions out. The intelligence gap widens in your favor.

Most data platforms deliver value linearly. Twice the data, twice the insight. DataFisher® is different. Because it extracts data across every stage of the value chain — distribution, service, customer, loyalty — every new source creates cross-domain correlations that were previously impossible.

When you add service data to distribution data, you don’t just see two things. You see why certain products have higher return rates in certain regions. When you add loyalty data to that, you see which customer segments are at risk before they churn. Each source multiplies the intelligence of every other source.

This is the compounding effect. And it means the longer you run DataFisher®, the wider the intelligence gap between you and competitors who are still waiting for Excel files on the 15th of every month.

1

Month 1 — Foundation

Primary and secondary sales data flowing. Stock visibility established. Basic anomaly detection active.

2

Month 3 — Cross-Domain

Service data connected. Distribution-to-service correlations surfacing. Predictive models beginning to calibrate.

3

Month 6 — Intelligence

Full value chain visibility. AI models mature. Demand sensing, churn prediction, and credit risk scoring operational.

4

Month 12 — Compounding

Twelve months of cross-domain data creates a proprietary intelligence asset. Predictions sharpen. Anomalies caught earlier. The gap is now a moat.

Intelligence Value Over Time
1x
Mo 1
3x
Mo 3
7x
Mo 6
16x
Mo 9
28x
Mo 12
Linear value Compounding cross-domain intelligence →

Your ecosystem data is waiting to be surfaced.

DataFisher® is for enterprises that operate through partner networks and need real-time visibility into every stage of the value chain — distribution, service, customer engagement, and loyalty. If your data is trapped in systems you don’t own, it’s time to extract it.